Effects on
Climate protection
⦁ Potential savings by taking trucks off the road
To calculate the potential CO2 emissions saved by transporting trucks by rail, this must be determined on the basis of the weights to be transported. The payload in the form of complete trucks is calculated using the current load weight. This can lead to a total weight of up to 44 tons. However, the trucks are certainly not always fully loaded, therefore an average filling weight of 80% is assumed. Furthermore, not every truck will be loaded at all. It is therefore assumed that 30% of all transports are empty runs. This results in an average truck loading weight of approx. 28,000 t.
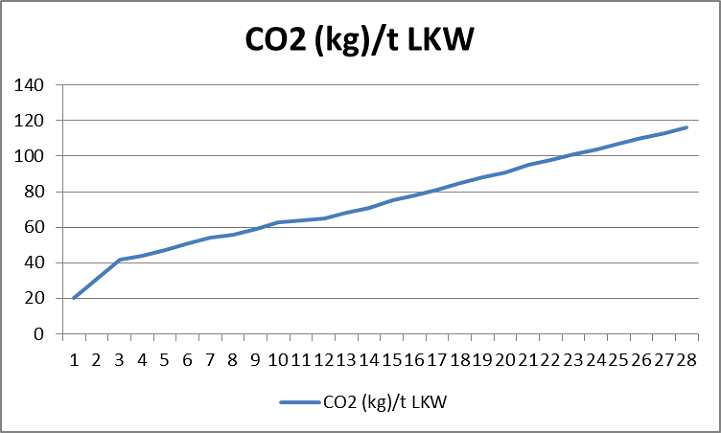
For the CO2 load during the transport of goods by truck nationally and internationally, the values up to 24 t and 100 km distance can be taken from the 'Klimanko' CO2 calculator. To obtain the CO2 value for the average truck in truck shuttle transport, the values given in the CO2 calculator were extrapolated up to the necessary weight of 28 t (diagram). This results in CO2 emissions per 100 km of 116 kg for trucks with a weight of 28 t.
For the selected network, a wagon daily kilometer offer of 6,120,000 km per day was calculated for the planned interval operation. If this distance were covered by trucks with their own propulsion on the road, this would result in a daily maximum CO2 emission of
116kg / 100km X 6.120.000 km/day = 7.099.200 kg CO2/day
od.7.099,2 t CO2/day
The truck shuttle is scheduled to run every day of the year, so the calculated value must be multiplied by 365 days. This results in a saving in the amount of
7,099.2 t/day X 365 days/year = 2,592,208 t CO2/year
⦁ Potential emission for the propulsion requirements of the truck shuttle
There are basically 2 ways to determine the CO2 emissions for the operation of the truck shuttle in the planned network. On the one hand, the CO2 emissions during power generation can be selected. On the other hand, the CO2 emission can be determined on the basis of the tons/kilometer in the planned network.
⦁ Determination of emissions via electricity generation
From a publication *) of the Federal Environment Agency it can be seen that the emission value for CO2 is falling due to continuous changes in the electricity mix in favor of alternative energies. For the year 2019, a value of 401 g/kWh was expected. More recent figures were unfortunately not available, but should continue to decline.
In addition, Deutsche Bundesbahn reports **) that it now obtains over 60% of its energy in rail freight transport from renewable forms of power generation. This means that no emissions are generated.
For the remaining 40%, electricity must be obtained from the German grid with an emission value of 401 g CO2. The railroad thus indirectly generates only 160 g of CO2 per kWh required to move freight trains.
The required kWh is calculated from the specific energy consumption for rail freight of 0.3 MJoul/tkm (equivalent to 83 Wh/tkm), the train weight and the distance covered in the year.
| Specific energy consumption in rail freight transport in Mjoul/tkm | 0,3 | *) In 2019, the CO2 emission factor for the electricity mix in Germany is estimated at 401 g per kilowatt hour. |
| Equivalent in Wh/tkm | 83 | |
| Energy consumption per train in Wh/km | 100.347 | |
| Energy consumption per train in kWh/km | 100,35 | |
| kWh per day (according to TS plan network) | 24.564.946 | |
| Traffic days per year | 365 | |
| kWh per year (according to TS plan network) | 8.966.205.144 | |
| Average kg CO2 emissions per kWh **) | 0,160 | **) Electricity mix DB |
| kg CO2 emissions (according to TS plan network) per year | 1.434.592.823 | 60% renewable energy [0 g CO2] |
| CO2 (t) emissions (according to TS plan network) in the year | 1.434.593 | 40% from German power grid [160 g CO2]. |
| *) - https://www.umweltbundesamt.de/presse/pressemitteilungen/bilanz-2019-co2-emissionen-pro-kilowattstunde-strom | ||
| **) - https://www.deutschebahn.com/de/presse/suche_Medienpakete/medienpaket_klimaschutzziel-1201550 |
The CO2 emissions for the electricity required to operate the truck shuttle per year using this calculation method are as follows
1,434,593 t CO2/year
⦁ Determination of emissions via characteristic values for the movement of tkm by rail
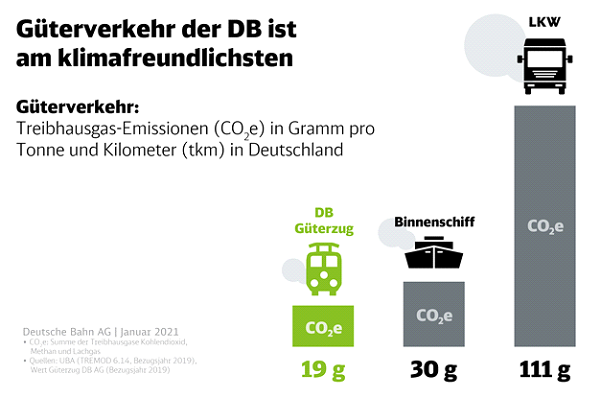
The basis for the CO2 calculation is the information **) provided by the railroads that each tkm of freight transport generates 19 g of CO2. This value must now be multiplied by the truck shuttle values for the mileage of the trains per year and the train weight.

This results in total CO2 emissions per year of
2,052,505 t CO2/year
Since both calculation methods conceal factors that are not comprehensible to the normal observer, the average value from both calculation methods is used in the following.
(2,052,505 + 1,434,593)/2 = 1,743,549 t CO2/year
⦁ Potential emissions balance when operating the truck shuttle
If the truck shuttle is used in the form described in the concept, a significant reduction in the greenhouse gas CO2 can be expected at full capacity. According to the previous explanations and calculations, this reduction amounts to
2,592,208 - 1,743,549 = 848,659 t CO2/year
As both the federal government and Deutsche Bahn continue to strive to reduce the emission value for power generation to 0 in the near future, the annual savings will continue steadily to then reach the emission value for pure truck operation on the road of 2,592,208 t CO2/year.
⦁ Reduction estimate for a first European extension of the Truck Shuttle.
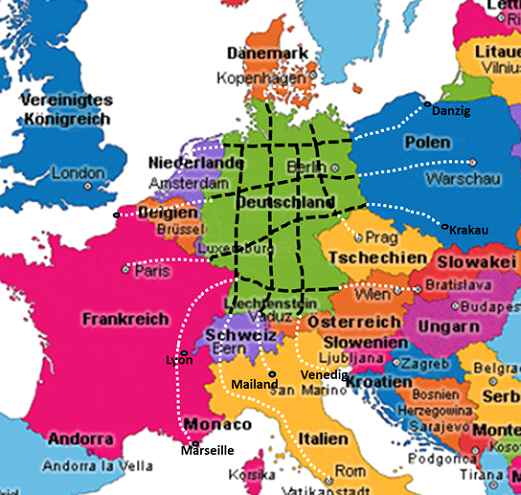
The Plan network has so far been considered only as far as the German border. However, the rail network extends across the whole of Europe. So it is understandable that in the first approach the north/south and west/east lines should be continued.
This would only require a loading station at the end of the extension.
However, it goes without saying that additional loading stations should be installed on the extension line according to the reasonableness, as listed below
| Prerequisite: | Raster beyond the borders of Germany | |||||
| Hourly cycle per day | km | km/h | Number of trains | Number of wagons | Wag. km/day | Train km/day |
| North/South Basel - Rome | 1270 | 100 | 25 | 635 | 1.524.000 | 60.960 |
| North/South Singen - Milan | 360 | 100 | 7 | 180 | 432.000 | 17.280 |
| North/South Garmisch - Venice | 430 | 100 | 9 | 215 | 516.000 | 20.640 |
| North/South Dresden - Prague | 150 | 100 | 3 | 75 | 180.000 | 7.200 |
| North/South Flensburg - Copenhagen | 320 | 100 | 6 | 160 | 384.000 | 15.360 |
| East/West Emden - Rotterdam | 360 | 100 | 7 | 180 | 432.000 | 17.280 |
| East/West Duisburg - Calais | 450 | 100 | 9 | 225 | 540.000 | 21.600 |
| East/West Saarbrücken - Paris | 410 | 100 | 8 | 205 | 492.000 | 19.680 |
| East/West Karlsruhe - Marseille | 900 | 100 | 18 | 450 | 1.080.000 | 43.200 |
| East/West Szczecin - Gdansk | 350 | 100 | 7 | 175 | 420.000 | 16.800 |
| East/West Frankfurt/Oder - Warsaw | 470 | 100 | 9 | 235 | 564.000 | 22.560 |
| East/West Görlitz - Krakow | 410 | 100 | 8 | 205 | 492.000 | 19.680 |
| East/West Passau - Bratislava | 360 | 100 | 7 | 180 | 432.000 | 17.280 |
| Totals | 6.240 | 125 | 3.120 | 7.488.000 | 299.520 |
The above table shows the European destination station extending beyond the domestic German destination station. This results in an extension of the existing planned network in both directions by 6,240 km in each case. The emission values can also be calculated for this.
If the trucks were to drive this distance under their own power, they would achieve a CO2 emission of
116kg / 100km X 7.488.000 km/day = 8.686.080 kg CO2/day
od.8.686,08 t CO2/day
and thus an annual issue of
8,686.08 t/day X 365 days/year = 3,170,419.2 t CO2/year
As no separate data are available for the neighboring countries
⦁ France
⦁ Luxembourg
⦁ Belgium
⦁ Netherlands
⦁ Denmark
⦁ Poland
⦁ Czech Republic
⦁ Slovakia
⦁ Austria
⦁ Switzerland
⦁ Italy
for the electricity costs for operating the Truck Shuttle, the emissions for operating the truck shuttle are calculated analogously to the German baseline values.
For this purpose, the previously calculated average CO2 savings of 848,659 t CO2/year are converted to the additional European routes to obtain the value for the additional km.
848,659 /6,120,000 X 7,488,000 = 1,038,359.2 t CO2/year
⦁ Total reduction estimate for the German plan network and potential networks in neighboring countries.
In addition to the domestic German network calculated so far together with the connections for the neighboring countries, the use of the Truck Shuttle should also be considered in the own network of these neighboring countries.
In the territorial states of France, Poland and Italy in particular, separate networks should be planned for the truck shuttle. Whether a north/south and east/west alignment would also be suitable here would still have to be clarified specifically. The total number of kilometers should be similar to Germany. Therefore, the CO2 emission, respectively the potential CO2 saving will be analogous to the previously calculated German values.
It is therefore possible to estimate a maximum total annual CO2 saving of approx. 5 million t to 10 million t for this area through the use of the truck shuttle concept.
However, it should also be noted that this would not yet cover the entire European rail network. Spain, Portugal, Great Britain, Scandinavia, the Baltic states, Belarus, Ukraine, Russia (European part), Hungary, Romania, Bulgaria, the Balkans and Greece are still missing for the use in the entire European rail network.
Based on the above calculations, it is easy to imagine the significant positive impact that a Europe-wide deployment of the Truck Shuttle would have on pollution and thus on climate change.
Customers
The customers of the Truck Shuttle, i.e. the forwarders and drivers, are subject to enormous cost and time pressure. For this reason, they will only accept a truck shuttle offer if the personal benefit is clearly recognizable to them. Roughly speaking, they will pay attention to the fact that the transport kilometer through the use of a truck shuttle does not become more expensive than the normally driven truck kilometer and that there is no additional burden for the drivers. For this purpose, first of all, it is important to determine the average cost of a transport kilometer truck. For this purpose, the resulting average values of the following min./max. assumptions are used.
| Average cost per km truck | 1,52 € | Total per km LL | 151,89 € | 303,78 € | 607,55 € | 911,33 € | 1.215,10 € | ||
| Forwarder consumption costs | min | max | Mean value | km mileage | 100 | 200 | 400 | 600 | 800 |
| Toll rates more than 4 axles per km | 0,13 € | 0,21 € | 0,17 € | 16,95 € | 33,90 € | 67,80 € | 101,70 € | 135,60 € | |
| Fuel consumption liters per km | 0,25 | 0,40 | 0,33 | 33 | 65 | 130 | 195 | 260 | |
| Fuel cost € per l | 0,95 € | 1,20 € | 1,08 € | 34,94 € | 69,88 € | 139,75 € | 209,63 € | 279,50 € | |
| Tire wear € per km | 0,05 € | 0,15 € | 0,10 € | 10,00 € | 20,00 € | 40,00 € | 60,00 € | 80,00 € | |
| Maintenance/repairs € per km | 0,10 € | 0,80 € | 0,45 € | 45,00 € | 90,00 € | 180,00 € | 270,00 € | 360,00 € | |
| Other savings due to reduced mileage per year € per km (see below) 2.) | 0,10 € | 0,80 € | 0,45 € | 45,00 € | 90,00 € | 180,00 € | 270,00 € | 360,00 € | |
| Other savings in: Taxes, insurance,acquisition costs, financing costs, driver's wages, etc.. |
So if truck shuttle transport costs no more than €1.52 per km on average, the other advantages such as higher utilization, better planning, extended utilization times (Sundays and public holidays) and greater reliability should lead to significant acceptance of the new service on the part of freight forwarders. This acceptance could be secured by working interactively with selected transport companies as early as the planning phase.
Since the use of the truck shuttle will result in a much more comfortable and also shorter travel time in addition to the monetary benefits for the carrier, the acceptance of the drivers is also certain.
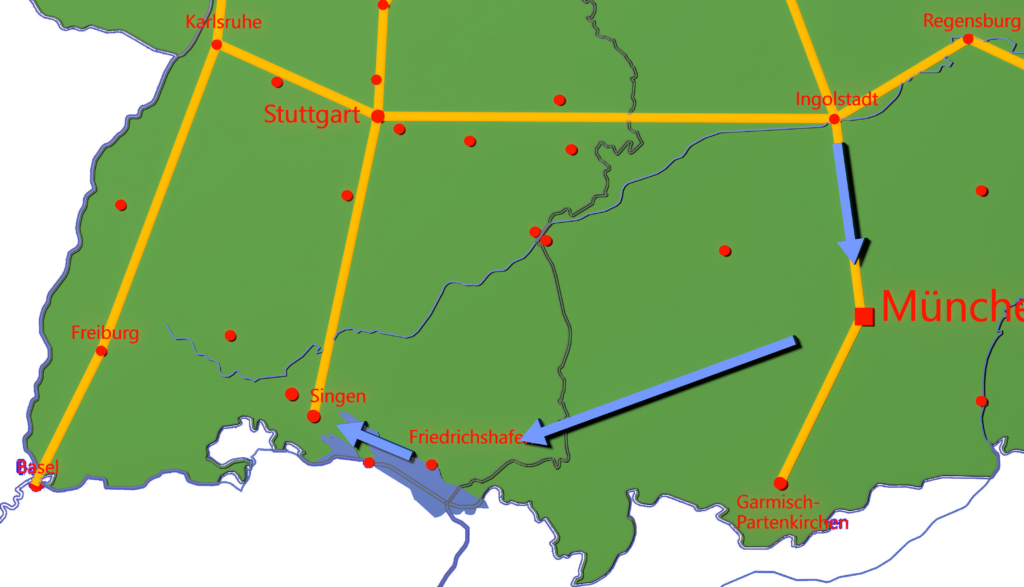
Example route/delivery of a forwarder
Planned outward/return freight
Freight forwarder location: Bremen
Loading outward freight: Bremerhafen
Unloading outward freight: Munich
Loading return freight: Friederichshafen
Unloading return freight: Emden
Assumptions/presuppositions:
⦁ Truck in self-operation always 60 km/h on average
⦁ TRUCK SHUTTLE always 100 km/h on average
⦁ Loading and unloading time of truck cargo always 1 hour
⦁ Loading and unloading possible around the clock
⦁ Unconditional compliance with working and driving times incl. breaks and rest periods
⦁ Duration of boarding and unboarding TRUCK SHUTTLE always 1 hour
⦁ Consequently, changeover always 2 hours
⦁ Common start Monday 06:30 at forwarding yard
⦁ Destination arrival at forwarding yard
⦁ Use of the existing road network as well as the listed example network
Use of the road network
As assumed in the example, the forwarder has received a freight from Bremerhaven to Munich. For this, he looks for a suitable return freight. This is accepted from Friedrichshafen on Lake Constance to Emden.
Thus, the truck of the forwarder drives the following route.
Outward journey:
A27 from Bremen to Bremerhaven
A27 from Bremerhaven to Bremer Kreuz
A1 from Bremer Kreuz to Westhofener Kreuz near Dortmund
A45 from Westhofener Kreuz to Seligenstädter Dreieck near Frankfurt
A3 from Seligenstädter Dreieck to Kreuz Nürnberg
A9 from Kreuz Nürnberg to unloading point in Munich
Onward journey:
Unloading point in Munich via A96 to Lindau exit
B31 from Lindau exit to Friederishafen loading point
Return trip:
B31 from Friderichshafen to Engen
A81 from Engen to Kreuz Heilbronn
A6 from Kreuz Heilbronn to Kreuz Walldorf
A5 from Kreuz Walldorf to Gambacher Kreuz
A45 from Kreuz Gambacher Kreuz to Westhofener Kreuz
A1 from Westhofener Kreuz to Dreieck Ahlhorner Heide near Cloppenburg
A29 from Dreieck Ahlhorner Heide to Kreuz Oldenburg Ost
A28 from Kreuz Oldenburg Ost to Dreieck Leer
A31 from Dreieck Leer to Emden
Drive home:
A31 from Emden to Dreieck Leer
A28 from Dreieck Leer to Dreieck Delmenhorst Ost
A1 from Delmenhoirst Ost to the depot in Bremen.
Taking into account the driving, rest and working times and observing the prescribed breaks, the following driving profile results
[LZ = driving time; AZ = working time].
| N° | Time /h | LZ | AZ | Activity | from | to | Day | km | Km road | AZ /h |
| 1 | 1 | x | x | Bremen-Bremerhaven trip | 6:30 | 7:30 | Monday | 60 | 60 | 1 |
| 2 | 1 | x | Loading | 7:30 | 8:30 | 1 | ||||
| 3 | 2,5 | x | x | Trip Bremerhaven - Osnabrück | 8:30 | 11:00 | 150 | 150 | 2,5 | |
| 4 | 0,75 | x | Break | 11:00 | 11:45 | 0,75 | ||||
| 5 | 4,5 | x | x | Trip Osnabrück - Giessen | 11:45 | 16:30 | 270 | 270 | 4,5 | |
| 6 | 9 | Resting time | 16:30 | 1:30 | Tuesday | |||||
| 7 | 4,5 | x | x | Trip Giessen - Nuremberg | 1:30 | 6:00 | 270 | 270 | 4,5 | |
| 8 | 0,75 | x | Break | 6:00 | 6:45 | 0,75 | ||||
| 9 | 2,5 | x | x | Trip Nuremberg - Munich | 6:45 | 9:15 | 150 | 150 | 2,5 | |
| 10 | 1 | x | Discharge | 09:15 | 10:15 | 1 | ||||
| 11 | 1 | x | x | Trip Munich - Buchlohe | 10:15 | 11:15 | 60 | 60 | 1 | |
| 12 | 9 | Resting time | 11:15 | 20:15 | ||||||
| 13 | 2 | x | x | Trip Buchlohe - Friederichshafen | 20:15 | 22:15 | 120 | 120 | 2 | |
| 14 | 1 | x | Loading | 22:15 | 23:15 | 1 | ||||
| 15 | 1,5 | x | x | Trip Friederichshafen - Tuningen | 23:15 | 00:45 | Wednesday | 90 | 90 | 1,5 |
| 16 | 0,75 | x | Break | 00:45 | 01:30 | 0,75 | ||||
| 17 | 4,5 | x | x | Trip Tuningen - Darmstadt | 01:30 | 06:00 | 270 | 270 | 4,5 | |
| 18 | 9 | Resting time | 06:00 | 15:00 | ||||||
| 19 | 4,5 | x | x | Trip Darmstadt - Werne | 15:00 | 19:00 | 270 | 270 | 4,5 | |
| 20 | 0,75 | x | Break | 19:00 | 19:45 | 0,75 | ||||
| 21 | 4 | x | x | Trip Werne - Emden | 19:45 | 23:45 | 240 | 240 | 4 | |
| 22 | 1 | x | Unload | 23:45 | 00:45 | Thursday | 1 | |||
| 23 | 9 | Resting time | 00:45 | 09:45 | ||||||
| 24 | 2,5 | x | x | Trip Emden - Bremen | 09:45 | 12:15 | 150 | 150 | 2,5 | |
| 78 | Total - time [h] and - distance [km] | 2100 | 2100 | 42 |
The driver needs a total of 78 hours for the assumed delivery and thus almost a whole week from Monday to Thursday. In the process, he uses 42 hours of his own working time. In total, he drives 2,100 km in normal operation, i.e. using his own combustion engine.
Use of the truck shuttle network
The boarding, transfer and alighting stations used for the sample tour are located in the immediate vicinity of the cities:
⦁ Emden
⦁ Oldenburg
⦁ Hamburg
⦁ Schwerin
⦁ Ingolstadt
⦁ Singen
So the northernmost east-west route is used, as well as the 2nd and 3rd north-south routes seen from the west.

The truck thus uses the following route.
Outward journey: The truck leaves the depot analogous to the pure road tour in Bremen and travels via the A27 to Bremerhaven.
After loading, it takes the shortest route to the nearest Truck Shuttle loading station near Oldenburg.

Here, it runs the west-east shuttle train [Emden-Stettin] eastbound and leaves it in Schwerin.
There he changes to the north-south shuttle train of the 3rd north-south lines [Schwerin - Garmisch Partenkirchen] and has himself brought to the loading station Ingolstadt.

From Ingolstadt, the truck travels via the A9 to the unloading location in Munich.
Onward journey: Then, analogous to pure road transport, it travels via the A96 to the Lindau exit and continues via the B31 to the new loading location in Friedrichshafen.
Return journey: After loading, the truck travels via the B31 to near Singen, where the final loading station of the 2nd north-south route [Flensburg - Singen] is located.
It travels on the northbound shuttle train and leaves it in Hamburg.
Here he changes to the east-west shuttle train [Szczecin - Emden] and leaves it in Emden.
Return journey: After unloading, it returns to the freight forwarder's depot in Bremen via the A31, A28 and A1 in the same way as pure road transport.
Taking into account the driving, rest and working times and observing the prescribed breaks, the following driving profile results for the shared use of the Truck Shuttle
[LZ = driving time; AZ = working time].
| Entering and leaving the loading bay in the loading station takes about 15 minutes. Changing trains also takes only 15 minutes. |
| N° | Time /h | LZ | AZ | Activity | from | to | Day | km | Km road | AZ /h |
| 1 | 1 | x | x | Bremen-Bremerhaven trip | 6:30 | 7:30 | Monday | 60 | 60 | 1 |
| 2 | 1 | x | Loading | 7:30 | 8:30 | 1 | ||||
| 3 | 1 | x | x | Trip Bremerhaven - Oldenburg | 8:30 | 9:30 | 60 | 60 | 1 | |
| 4 | 1 | x | Travelling train | 9:30 | 10:30 | 1 | ||||
| 5 | 3 | TRUCK SHUTTLE Oldenburg - Schwerin | 10:30 | 13:30 | 300 | |||||
| 6 | 1 | Leaving train | 13:30 | 14:30 | ||||||
| 7 | 1 | Travelling train | 14:30 | 15:30 | ||||||
| 8 | 7 | TRUCK SHUTTLE Schwerin - Ingolstadt | 15:30 | 22:30 | 700 | |||||
| 9 | 1 | x | Leaving train | 22:30 | 23:30 | 1 | ||||
| 10 | 1 | x | x | Trip Ingolstadt - Munich | 23:30 | 00:30 | Tuesday | 90 | 90 | 1 |
| 11 | 1 | x | Unload | 00:30 | 01:30 | 1 | ||||
| 12 | 1,5 | x | x | Trip Munich - Memmingen | 01:30 | 03:00 | 90 | 90 | 1,5 | |
| 13 | 0,75 | x | Break | 03:00 | 03:45 | 0,75 | ||||
| 14 | 1,5 | x | x | Trip Memmingen - Friederichshafen | 03:45 | 05:15 | 90 | 90 | 1,5 | |
| 15 | 1 | x | Loading | 05:15 | 06:15 | 1 | ||||
| 16 | 1 | x | x | Trip Friederichshafen - Singen | 06:15 | 07:15 | 60 | 60 | 1 | |
| 17 | 1 | x | Travelling train | 07:15 | 08:15 | 1 | ||||
| 18 | 8 | TRUCK SHUTTLE Singen - Hamburg | 8:15 | 16:15 | 800 | |||||
| 19 | 1 | Leaving train | 16:15 | 17:15 | ||||||
| 20 | 1 | Travelling train | 17:15 | 18:15 | ||||||
| 21 | 3 | TRUCK SHUTTLE Hamburg - Emden | 18:15 | 21:15 | 300 | |||||
| 22 | 1 | x | Leaving train | 21:15 | 22:15 | 1 | ||||
| 23 | 1 | x | Unload | 22:15 | 23:15 | 1 | ||||
| 24 | 2,5 | x | x | Trip Emden - Bremen | 23:15 | 02:45 | Wednesday | 150 | 150 | 2,5 |
| 43,25 | Total - time [h] and - distance [km] | 2700 | 600 | 18,25 |
The driver needs a total of 43.25 hours for the assumed delivery using the truck shuttle and thus from Monday to Wednesday (very early), i.e. less than 2 days. In the process, he consumes 18.25 hours of his own working time.
It travels a total of 600 km in normal operation, i.e. using its own combustion engine. The truck is transported electrically for 2,100 km on a total of 4 truck shuttle trains.
If one disregards minor shunting operations on the loading yard premises, the driver is not at the wheel for approx. 14 hours on the outward journey and approx. 15 hours on the return journey and is thus in the rest period.
| Working time: | Type | h |
| Street | 42,00 | |
| Truck Shuttle | 18,25 | |
| Difference | 23,75 | |
| Route comparison | Type | km |
| Variant 1 | Street only | 2100 |
| Variant 2 | Truck Shuttle | 2700 |
| thereof road kilometers | 570 | |
| Difference variants | 600 | |
| Additional costs for truck operation due to longer route | ||
| €/km | 1,52 € | |
| Total | 912,00 € | |
| Reduced costs for the driver due to shorter working hours | ||
| €/h | 20,00 € | |
| Total | 475,00 € | |
| Cost difference (additional costs) | 437,00 € | |
| Advantage: 2 trips per week for the same truck would be possible. | ||
| So almost double the revenue with the same equipment!!!! |
E-mobility
The use of electric trucks is already being planned by many manufacturers. Since the problem of long ranges, analogous to that of electric cars, mainly concerns the capacity and weight of the batteries required, the truck sector is also experimenting with technologies that see the truck continuing on the highway, but supplying power there via an overhead line. To this end, it is predicted that about 4,000 km of highway in the right lane can be provided with an overhead line. This can alleviate the problem of ranges somewhat, but is still in normal road traffic with all the risks there, which cannot be planned. Furthermore, it is imperative that an internal combustion engine is also installed in trucks in addition to the electric drive. This is therefore a solution that can only be practiced as long as combustion engines are still permitted at all for reasons of climate technology.
From the truck shuttle's point of view, these restrictions can be bypassed. Here, the truck is connected to the train's electronic network after being loaded onto the special wagon. Each special wagon has a charging station for this purpose. The travel time can thus also be used for recharging. The truck thus always leaves the Truck Shuttle 'fully refueled'.
In this way, the range problem could already be completely eliminated today. Electric trucks currently have a maximum range of around 400 km. This should be enough to get from leaving the truck shuttle at its own destination loading station to unloading the goods at the customer's site. Since the loading stations are planned in a maximum grid of approx. 200 km, the electric truck still has sufficient capacity to get to the next loading station and continue its journey there via truck shuttle.
If we think in European terms, an electric truck would theoretically already be able to reach any place in Europe without capacity problems today, or at the latest after installation of the truck shuttle network. Investments in extending the range of electric trucks would therefore no longer be necessary.
Infrastructure
The domestic German road network is very heavily congested in terms of traffic. On the one hand, this leads to a high volume of traffic with dense, slow-moving traffic and ever-increasing traffic jams, and on the other hand to heavy loads and wear and tear on the entire infrastructure. Trucks play a major role in the damage caused in this way. It is generally known that one truck puts at least as much strain on the roads as about 30,000 passenger cars. According to the 4th power law, this value would result for a 40t truck with 6 axles.
| CAR | TRUCK | FACTOR | |
| Weight / t | 1 | 28 | |
| Number of axes | 2 | 5 | |
| Weight per axle / t | 0,5 | 6 | 11,2 |
| Load according to 'Fourth Power Law'. | 15.735 | 1 |
If the average weight of approx. 28 t and the normal number of 5 axles is entered into the formula for truck shuttle use, the result is a load like approx. 15,735 passenger cars. Although this is less than the officially traded value, it still leads to considerable damage to roads and bridges as can be seen from the many construction sites.
The parking problem on the highways is also clearly visible. Since the driving times of the drivers are subject to strict rules, the majority of them try to find a free space in the evening for the prescribed 9-hour rest period. This search is becoming increasingly difficult and leads to unpleasant improvisation solutions such as parking in the entry and exit areas or in the parking lots of service areas and parking lots.
| ф km/h truck | 60 | |||
| ф Driving hours/day | 5 | 6 | 7 | 8 |
| ф daily LL km | 300 | 360 | 420 | 480 |
| ф Truck /day | 20.400 | 17.000 | 14.571 | 12.750 |
| ф Length truck/m | 17 | |||
| ф km truck queue per day | 347 | 289 | 248 | 217 |
Assuming an average truck speed of 60 km/h, there could be up to 20,400 fewer trucks on our country roads and highways, depending on the planned driving hours or mileage per day, which could then switch to the truck shuttle. This would correspond to a traffic jam, bumper to bumper, of about 350 km in length.
Security
Both the reduction of the absolute number of trucks on the road and the fact that drivers who use the Truck Shuttle are much more rested at the wheel afterwards will significantly increase road safety. Since traffic accidents involving trucks are usually much more serious and often result in fatalities, the positive influence of the Truck Shuttle will also be noticeable and visible in the statistics.